Here is a way to teach the Results-Based Accountability thinking process which will work with any audience. (Your script in bold and Audience likely responses in quotes.)
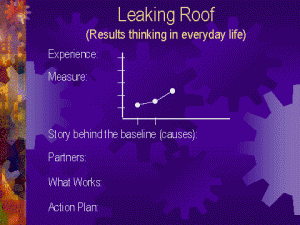
1. Draw the picture on the right on a piece of flipchart paper. (Or use the Powerpoint version. Click here to go to the RBA 101 in Powerpoint which includes this slide and animation of the next several steps.)
2. Ask “How many people here have ever had a leaking roof?” (Most hands will go up.)
3. How can you tell if the roof is leaking? (“Water on the floor, down the walls etc.”) So, this is how you might “experience” a leaking roof.
4. How could you measure how badly the roof is leaking? (“By how much water…”) So you might put out a bucket and measure the number of inches in the bucket after each rainstorm! That’s the chart at the right: the number of inches from the last three rainstorms.
5. Where do you think this line is headed if we don’t do anything? (“It will get worse. Through the roof, you might say.”) Draw a forecast line going up. This is the forecast of where we’re headed if we don’t do anything. We want to turn this curve to zero, right! Draw it.
6. Now, what’s the first thing you do when you have a leaking roof? (” You get up on the roof and try to find out why it’s leaking.”) Right! You look for the cause of the leak. And this is the story behind the baseline, the causes of why this picture looks the way it does.
7. Who are some of the people who might help you fix the leak? (brother-in-law, neighbor, professional roofer) These are some of your potential partners.
8. Now, what kinds of things work to fix a leak? (Patching material, get a whole new roof, sell the house.) You have some choices about types of patching material. Some will work better than others. Tar is probably better than duct tape.
9. So let’s review. You’ve got a leaking roof. It’s getting worse and will keep getting worse unless you do something. You actually have the data on this. You’ve figured out the cause of the leak and the partners who might help fix it. And you’ve considered some of the possible ways to fix it. Now the important final question is what are you going to do? This is your action plan.
10. So now you’ve implemented your action plan. Maybe you’ve hired a roofer who’s gotten up on the roof and patched it. And now what’s the next thing you do? (“Wait for the next rainstorm.”) Right! You wait for the next rainstorm to see if it’s still leaking. And what if it’s still leaking, what do you do? (Draw a new point lower but not zero.) (“You get back up on the roof.”) Right! You start the whole process over again. You look for causes. You think about who can help and what works. And you try something else – maybe sell the house this time. This is an iterative process. Hopefully you fix the roof in one pass. But the things we are working on are much more complicated than a leaking roof, and one iteration won’t do it.
11. So, this is the whole thinking process! It’s just common sense. It’s how we solve everyday problems. And communities working to improve the quality of life, or managers working to improve their program’s performance can use this same process. This is the thinking process at the heart of results and performance decision making! If you understand this process, you can go home now.
12. Notice that we identified the “inches per bucket” measure pretty easily. With a leaking roof, it’s obvious what’s important and what could be measured. But with programs, agencies and service systems, the choice of what’s important and what to measure is much more complex. That’s the process that’s addressed when we choose indicators or performance measures. ( See for Question 3.7 for more information on choosing program, agency or service system performance measures. And see Question 2.7 for more information on the process for choosing indicators for population well-being.)
13. Finally, notice that, in real life, we don’t actually put out a bucket and measure the inches of water. We do this work based entirely on the way we experience the leak. We consider it fixed when we don’t see water anymore. It is also possible to run the results decision-making processes without data, and use just experience. An action plan can be developed this way. It’s a way to get started. But ultimately this is unsatisfying. In complex systems, you generally need data to see if you are making progress or not. Otherwise you are left with just stories and anecdotes. So if you don’t have any data at all, you might start the process on the basis of experience. But you should give great attention to pursuing your Data Development Agenda.

